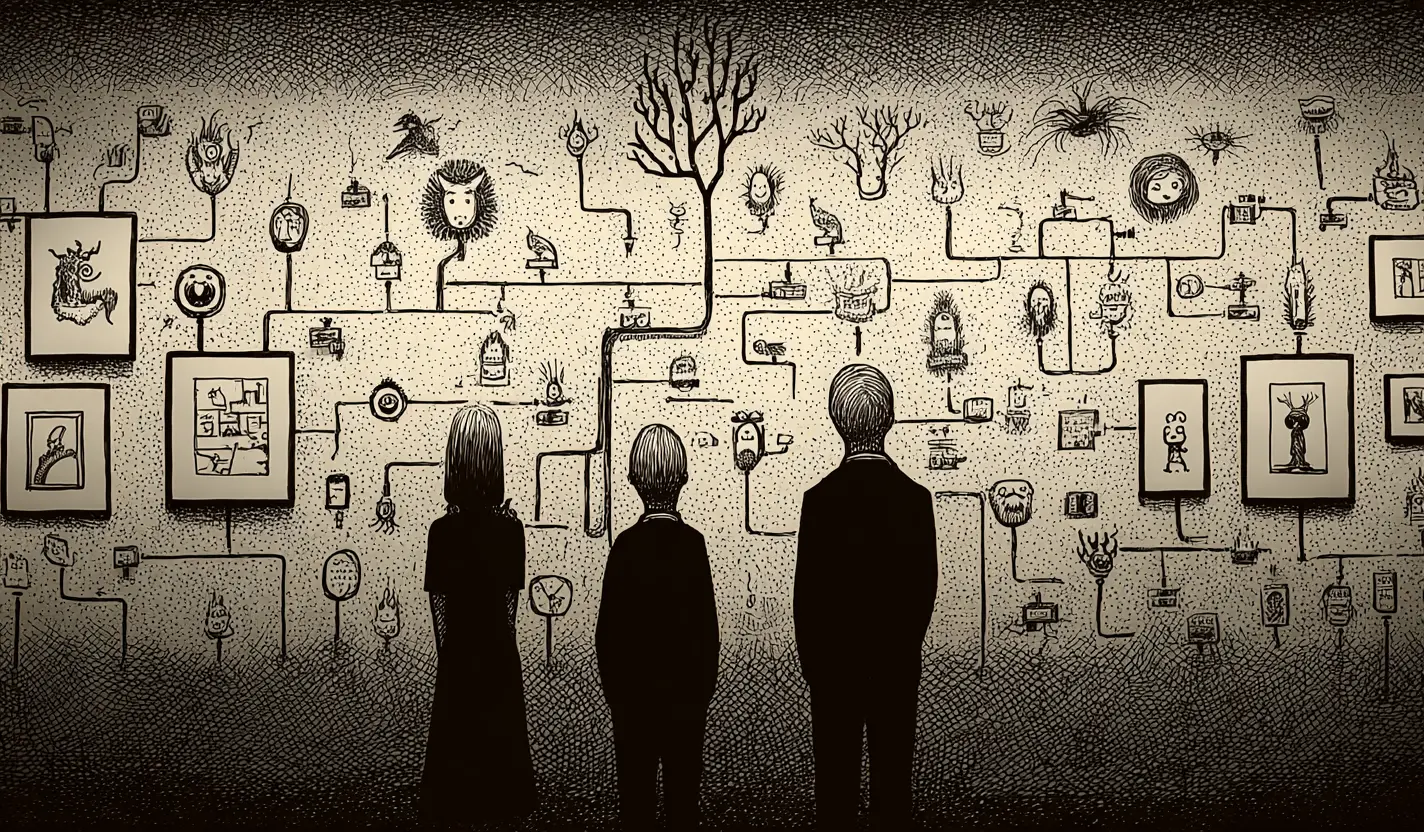
We treat numbers like they descended from heaven on stone tablets.
As if quantification itself confers truth. As if the act of measurement makes something real, important, objective. We build entire systems around this reverence—performance reviews that reduce complex human work to ratings, algorithms that compress messy social realities into binary predictions, dashboards that claim to capture organizational health in three colored dots.
The problem isn't that we use data. The problem is that we mistake the measurement apparatus for reality itself.
The Bureaucratic Origins of "Objectivity"
Here's something most people don't know: the drive toward quantification in science had less to do with accuracy and more to do with bureaucracy.
Historian Theodore Porter traces how numbers came to replace trust in public institutions. State bureaucracies needed systems that were standardized, transparent, easy to audit. You can't check whether someone followed their gut, but you can check whether they followed a formula.
Porter found that in public measurement systems, there's a "strong incentive to prefer readily standardizable measures to highly accurate ones." Translation: we choose metrics that are easy to compare over metrics that are actually true. If one lab uses state-of-the-art analysis while others use the standard protocol, the advanced method gets viewed as "a vexing source of interlaboratory bias"—not as an improvement in accuracy.[mfn]Porter, T. M. (1994). Trust in Numbers: The Pursuit of Objectivity in Science and Public Life. As discussed in Stephen John, Objectivity in Science (Cambridge University Press, 2021).[/mfn]
Let that sink in: better measurement gets rejected because it doesn't fit the system.
This is how data becomes sacred. Not because numbers tell us more truth, but because numbers let institutions function with less friction. Quantification lets you scale surveillance, standardize decisions, and avoid messy human judgment. Those are useful features. But they're administrative features, not epistemic ones.
We've confused "easy to audit" with "objectively true."
When Measurement Obscures Rather Than Reveals
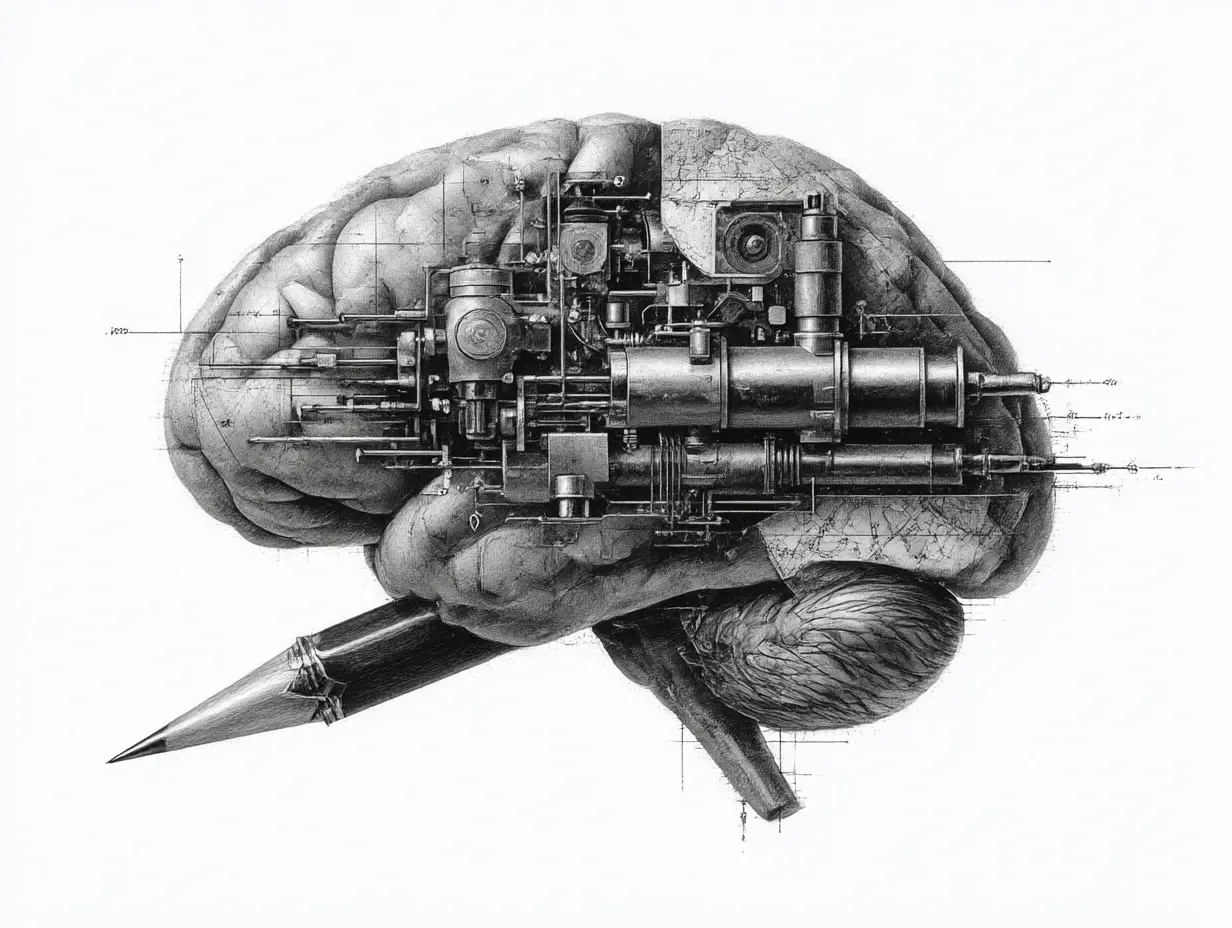
Numbers compress knowledge. That's their power and their danger.
When I say "John is heavy," I'm making a qualitative observation embedded in context. When I say "John weighs 150 pounds," I've created something that looks more precise. But I've also lost information. Heavy compared to what? In what context? For what purpose? The number gives the illusion of objectivity while hiding all the judgments that went into defining what we'd measure and how.
This is why Frederick Helmholtz warned us over a century ago: "A law of nature is not a mere logical conception that we have adopted as a kind of memoria technica to enable us more readily to remember facts."
Yet that's exactly how we use metrics now—as memoria technica that we've mistaken for the territory itself.
The Renaissance understood something we've forgotten. When physicians treated patients, they considered the whole person: family situation, position in society, education, temperament, the larger social cosmos. Mental and physical health were inseparable from the conditions in which people lived. Balance at the individual level required balance at the community level.[mfn]An Interdisciplinary Approach to the Human Mind: Subjectivity, Science and Experiences in Change (Routledge, 2018).[/mfn]
We've traded that holistic view for standardized measures. Not because they're more accurate, but because they're easier to scale.
The System Mistaking Itself for Reality
Here's the recursion that breaks everything: we build measurement systems to understand the world, then we start organizing the world to fit our measurement systems.
Education optimizes for test scores. Healthcare optimizes for billable procedures. Organizations optimize for quarterly metrics. We're no longer measuring reality—we're constructing a reality that's optimized for measurement.
Theodore Porter calls this the replacement of "rich trust" with "mere reliance." [mfn]Porter, T. M. (1994). Trust in Numbers: The Pursuit of Objectivity in Science and Public Life. As discussed in Stephen John, Objectivity in Science (Cambridge University Press, 2021).[/mfn] In rich trust, you trust a person's judgment, their expertise, their ability to navigate complexity. In mere reliance, you trust the system, the protocol, the number—not because it's more accurate, but because it's more defensible.
When measurement becomes the goal instead of the tool, smart people stay stuck optimizing for proxies while the actual problem remains untouched. We mistake procedural objectivity (following the rules) for process objectivity (generating accurate understanding). They're not the same thing.
What We Lose When We Make Data Divine
Quantification creates a mirage of universal applicability. If it's a number, it must be comparable. If it's measured the same way, the cases must be alike.
But reality resists this compression. Social phenomena don't follow causes with "the same certainty as they do in the physical universe." Humans aren't governed by unvarying laws that make their actions "furnish the materials of scientific study."[mfn]The Scientific Method and Its Limitations (Stanford University Press, 1899).[/mfn]
When we force human complexity into numerical frameworks, we lose:
- Context: The circumstances that make a number meaningful or meaningless
- Judgment: The expertise to know when rules should bend
- Nuance: The qualitative differences that numbers can't capture
- Emergence: The patterns that only appear when you stop measuring
Most critically, we lose the ability to see what we're not measuring. Our dashboards don't show us the slow accumulation of coordination failures, the quiet erosion of trust, the invisible systems creating dysfunction. These don't show up in the metrics because we built the metrics for managerial convenience, not diagnostic truth.
Seeing the System
This isn't an argument against data. It's an argument against mistaking data for divinity.
Data can reveal patterns. But only if we remember:
- Numbers are maps, not territory. They compress reality in ways that are useful for some purposes and misleading for others. The compression itself is a choice laden with values.
- Measurement systems reflect power. Who decides what to measure? Who benefits from standardization? Whose reality gets erased when we force everything into comparable units?
- Objectivity is a process, not a product. It's not the number that makes something objective—it's the quality of the process that generated the number, and our honest reckoning with what that process captures and what it misses.
- Some things resist measurement. And that resistance might be information, not noise.
The most important question isn't "What does the data say?" It's "What did we have to ignore to make this legible as data?"
---
When institutions treat data as divine revelation rather than one tool among many, they create systems that punish awareness and reward optimization theater. They build elaborate infrastructure for capturing metrics while the actual problems metastasize in the unmeasured spaces.
You don't have to reject data to see this. You just have to stop treating the measurement apparatus as reality itself.
The map is not the territory. The dashboard is not the organization. The metric is not the goal.
Data is not divine. It's just a number, in a context. Useful when understood, dangerous when worshipped.